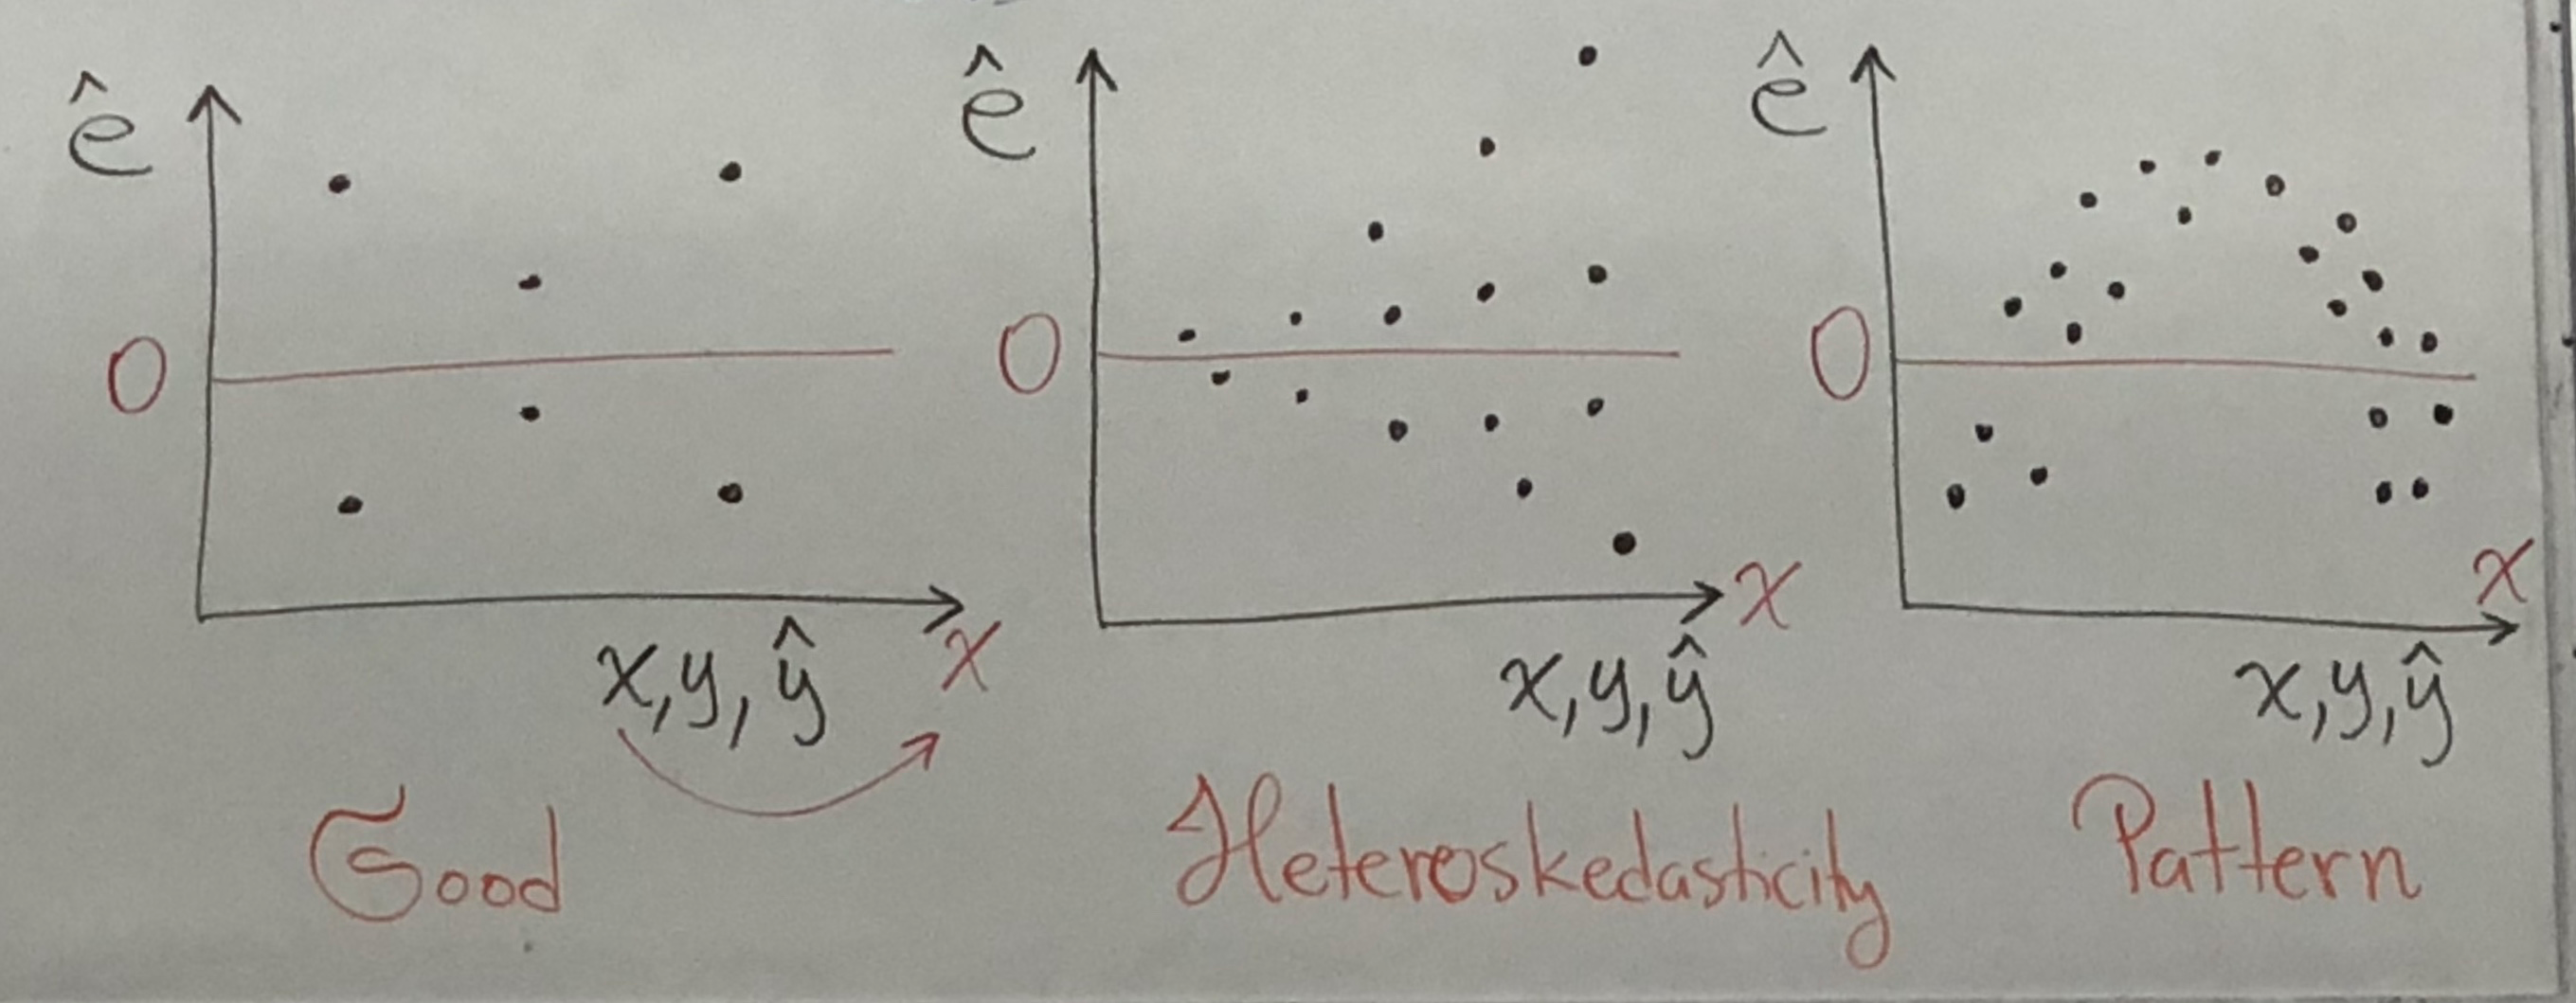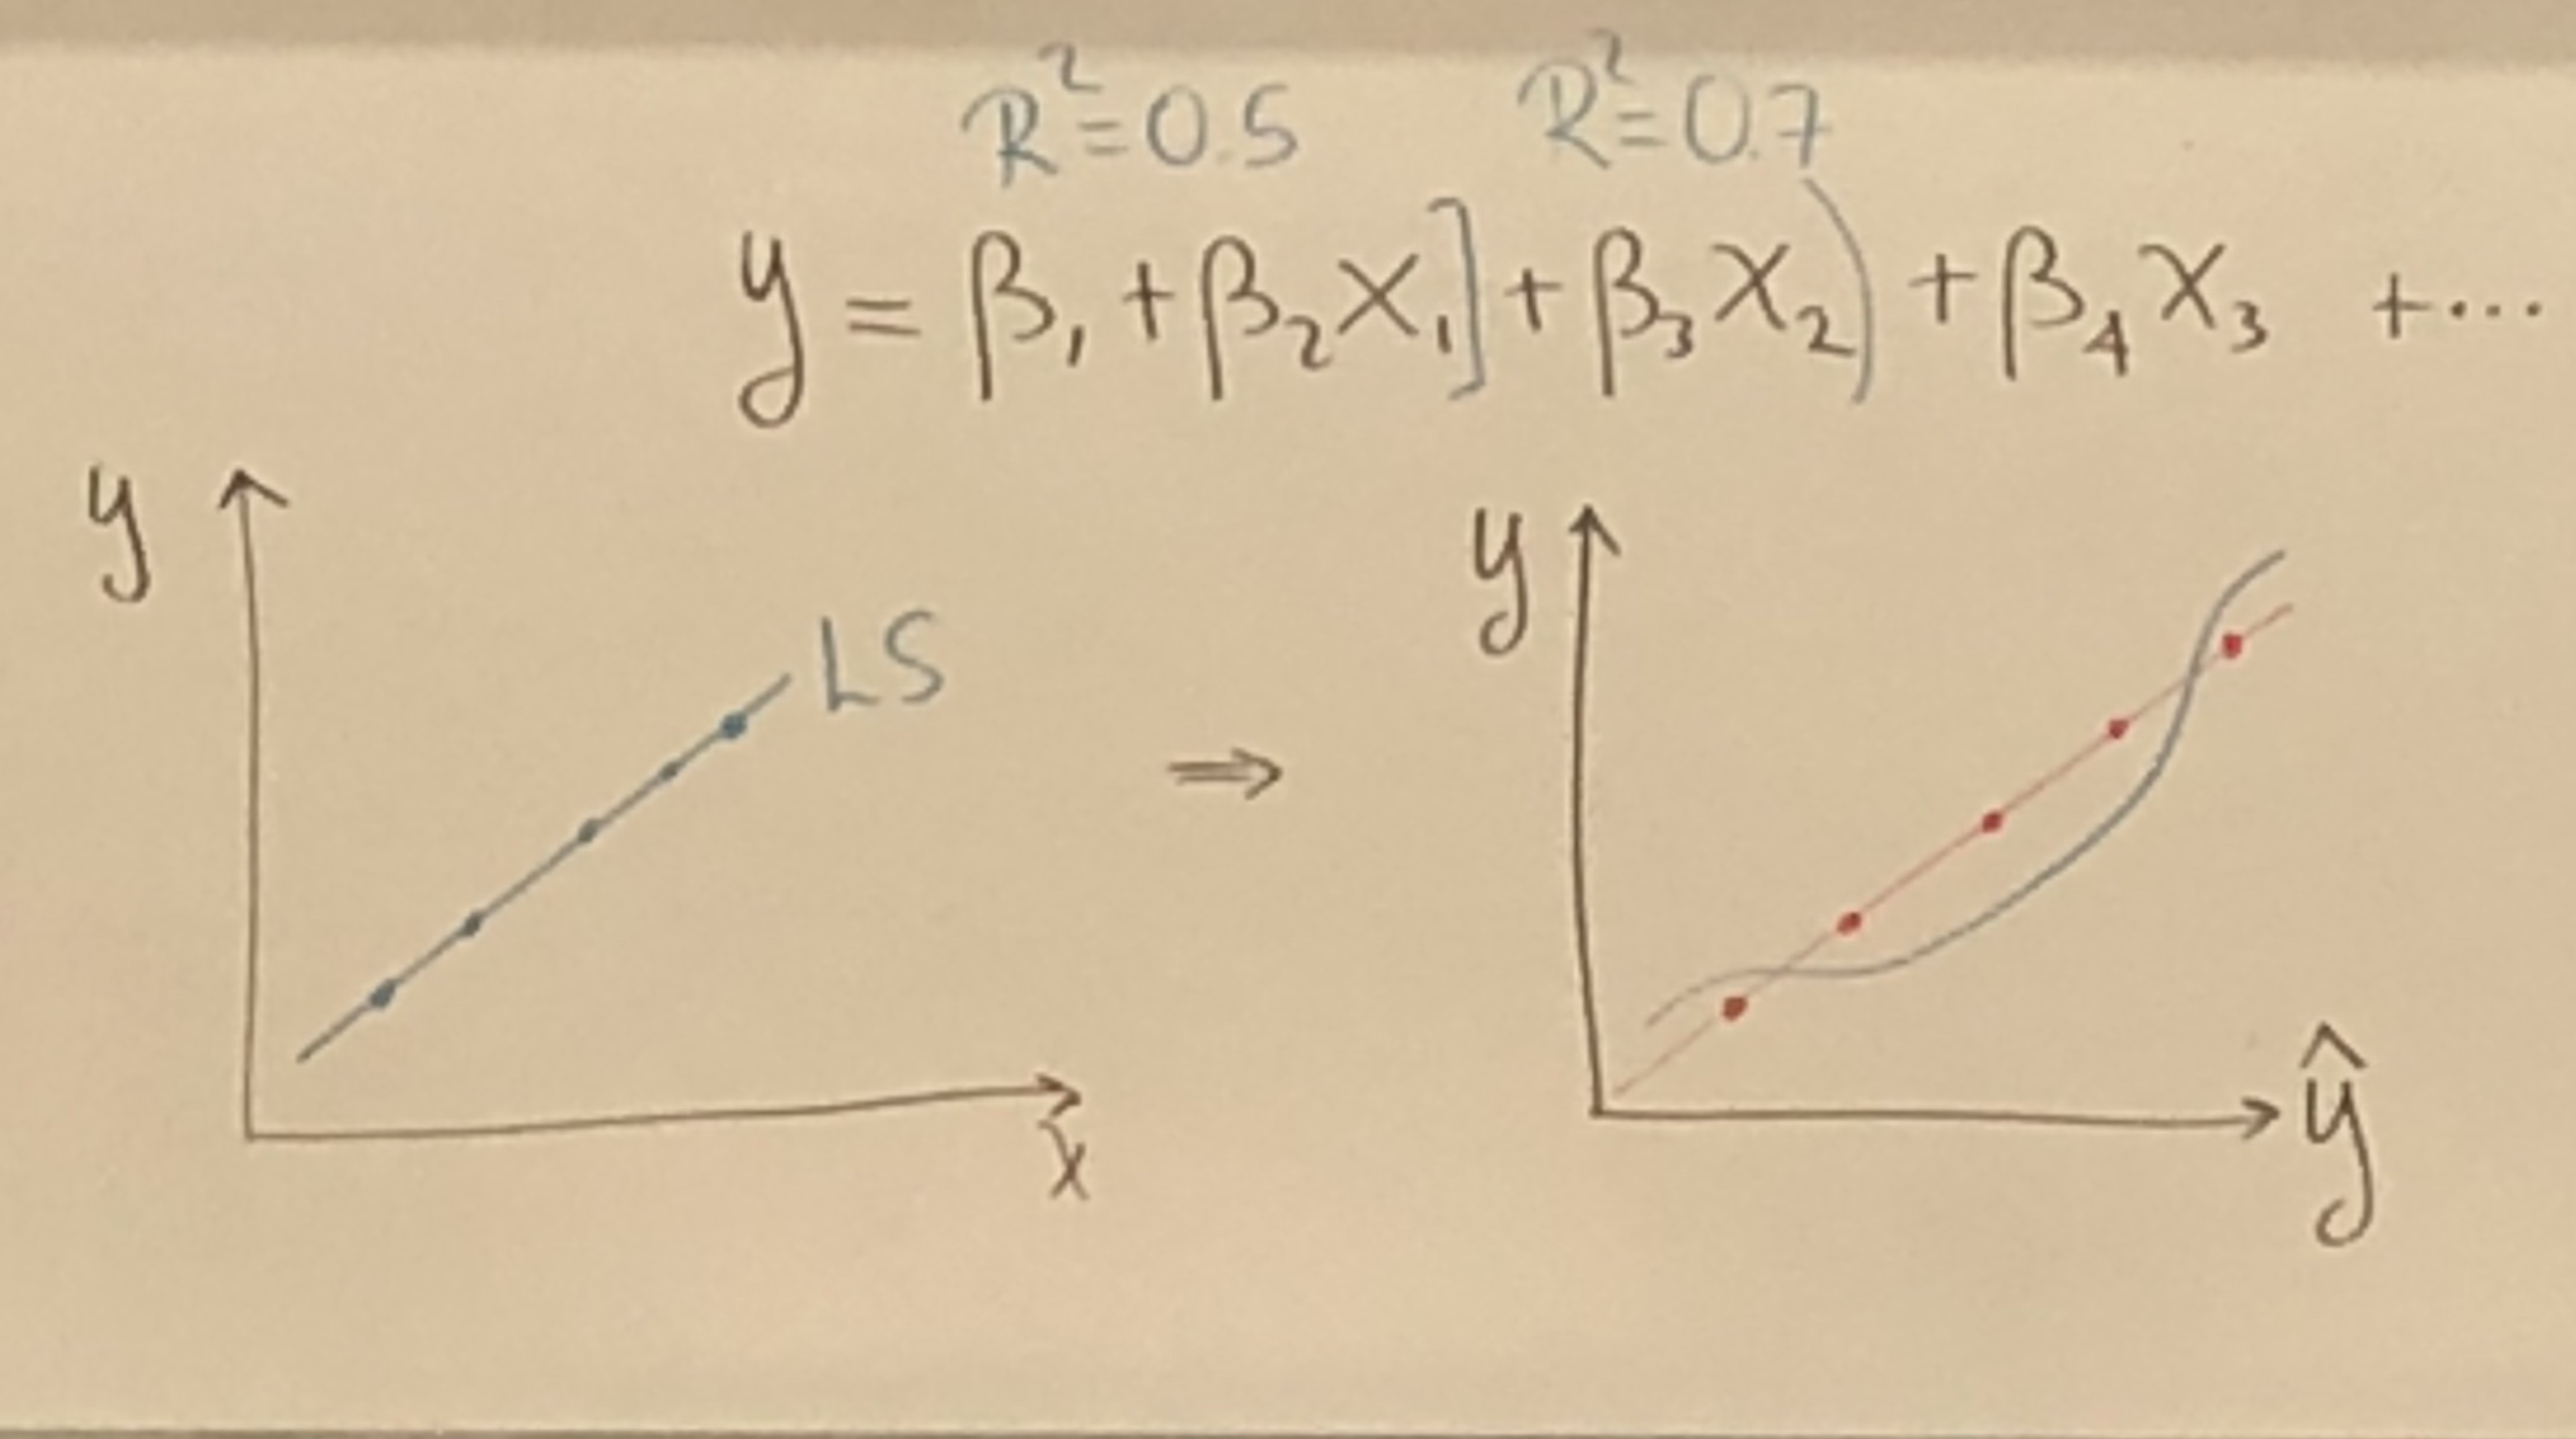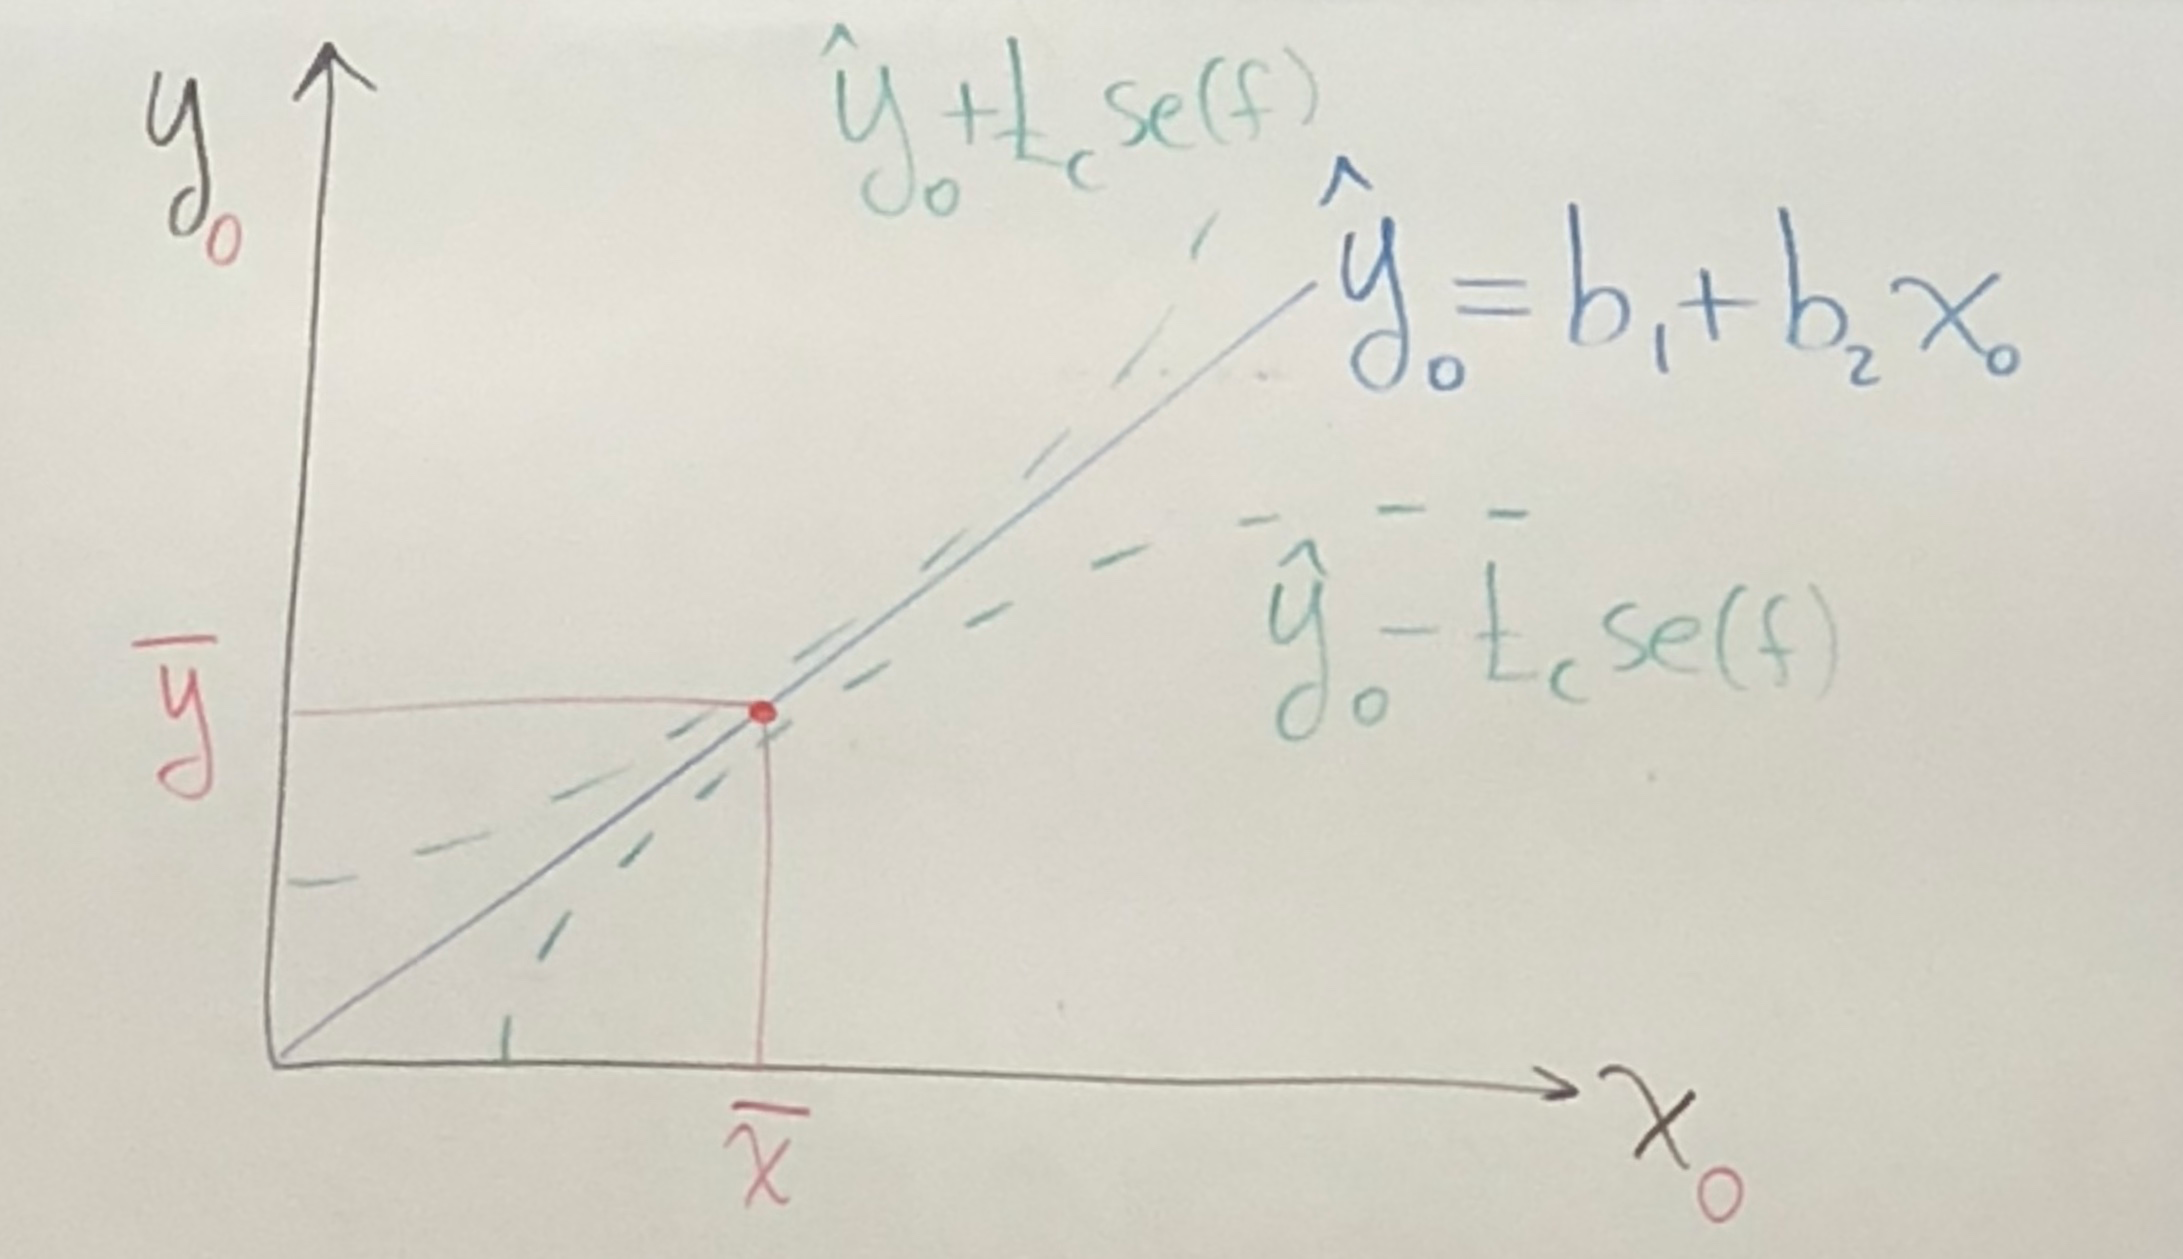
Known:
Predict :
Estimate:
Def: Forecast , →
→ is an unbiased predictor of , the best linear Unbiased predictor(BLUP) of if SR1-SR5 hold.
→
↓ as ↑, ↑ as →
Since we don’t know , we use
Def: standard error of the Forecast
Def: Predictor Interval

In practice, we estimate with
→ →
→ →
= Total sum of squares =
= Sum of squares due to regression =
= Sum of squares due to Error =
proportion of variance explained in by the regression.
,
sample Cov
r measures the strength of the linear association between and
Model: , c is constant;
| Transformation | Slope | Intercept | t_{stat} | |
|---|---|---|---|---|
| → | same | same | ||
| → | - | same | same |
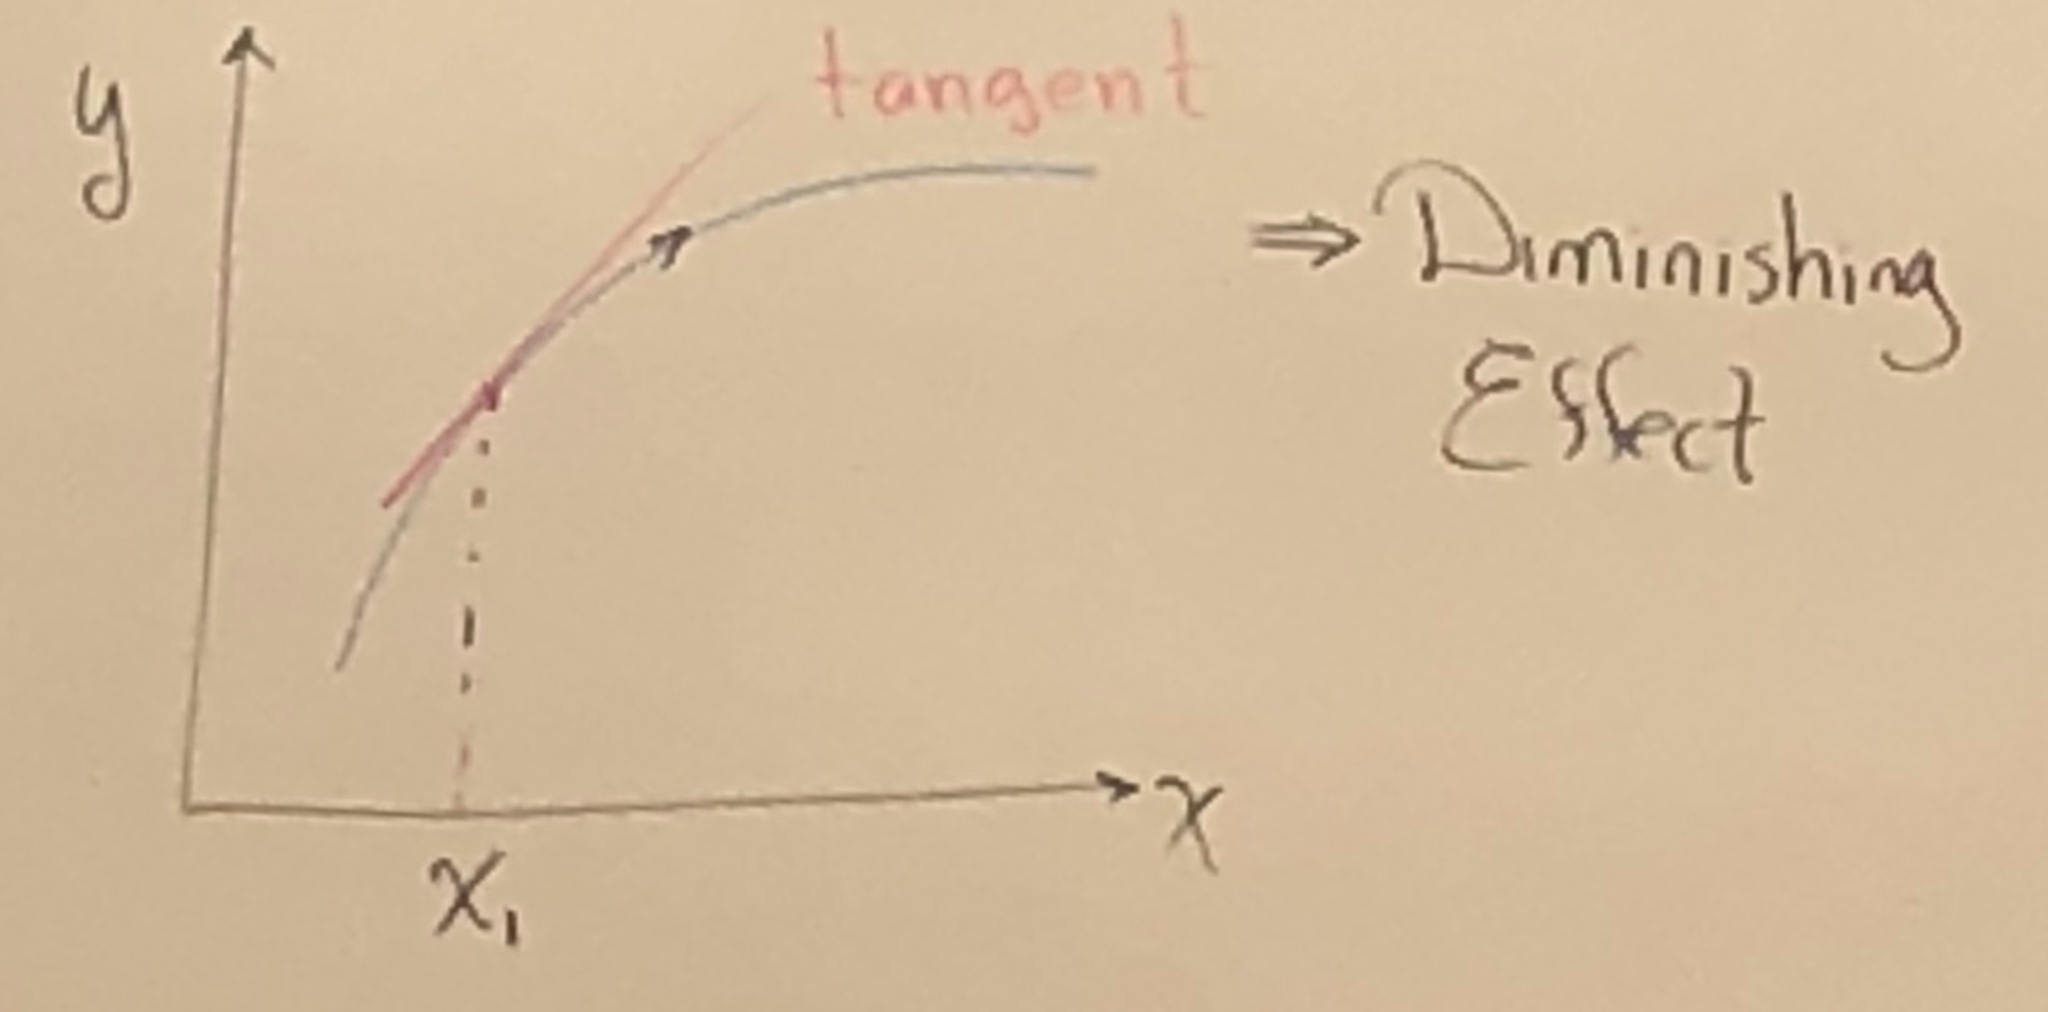
Notes: , when is small.
Slope , Elasticity
Slope Interpretation:
change in is associated with a change in of
Known: , std error respectively,
Slope Interpretation
Slope: increase in Income is associated with a increase in test scores of points.
Predicted Difference in test scores foe districts with average incomes of $10,000 Vs. $11,000, and $40,000 Vs. $41,000 →
Note: For vs. →
Slope , Elasticity
Slope Interpretation:
1 unit change in is associated with a change in , or
Known: Ln(Earnings) , std error respectively,
Slope: , Elasticity:
Slope interpretation: Elasticity with respect to .
if the percentage change in is 1% (△x = 0.01x), then is the respective percentage change in .
, , with std error of and is respectively.
Slope Interpretation: A increase in income is estimated to correspond to a increase in Test Scores.
Prediction:
special case: Log-Linear Model
→
, Since ,
→
prediction interval for
Note:
Source of , Let ~,
→ , where
DEF: Generalized
Recall
Test for normally inputs are the skewness and kurtosis, Test performed on the residuals.
where kurtosis and skewness , → Normal distribution .
~
Kurtosis measures peakedness(or flatness);
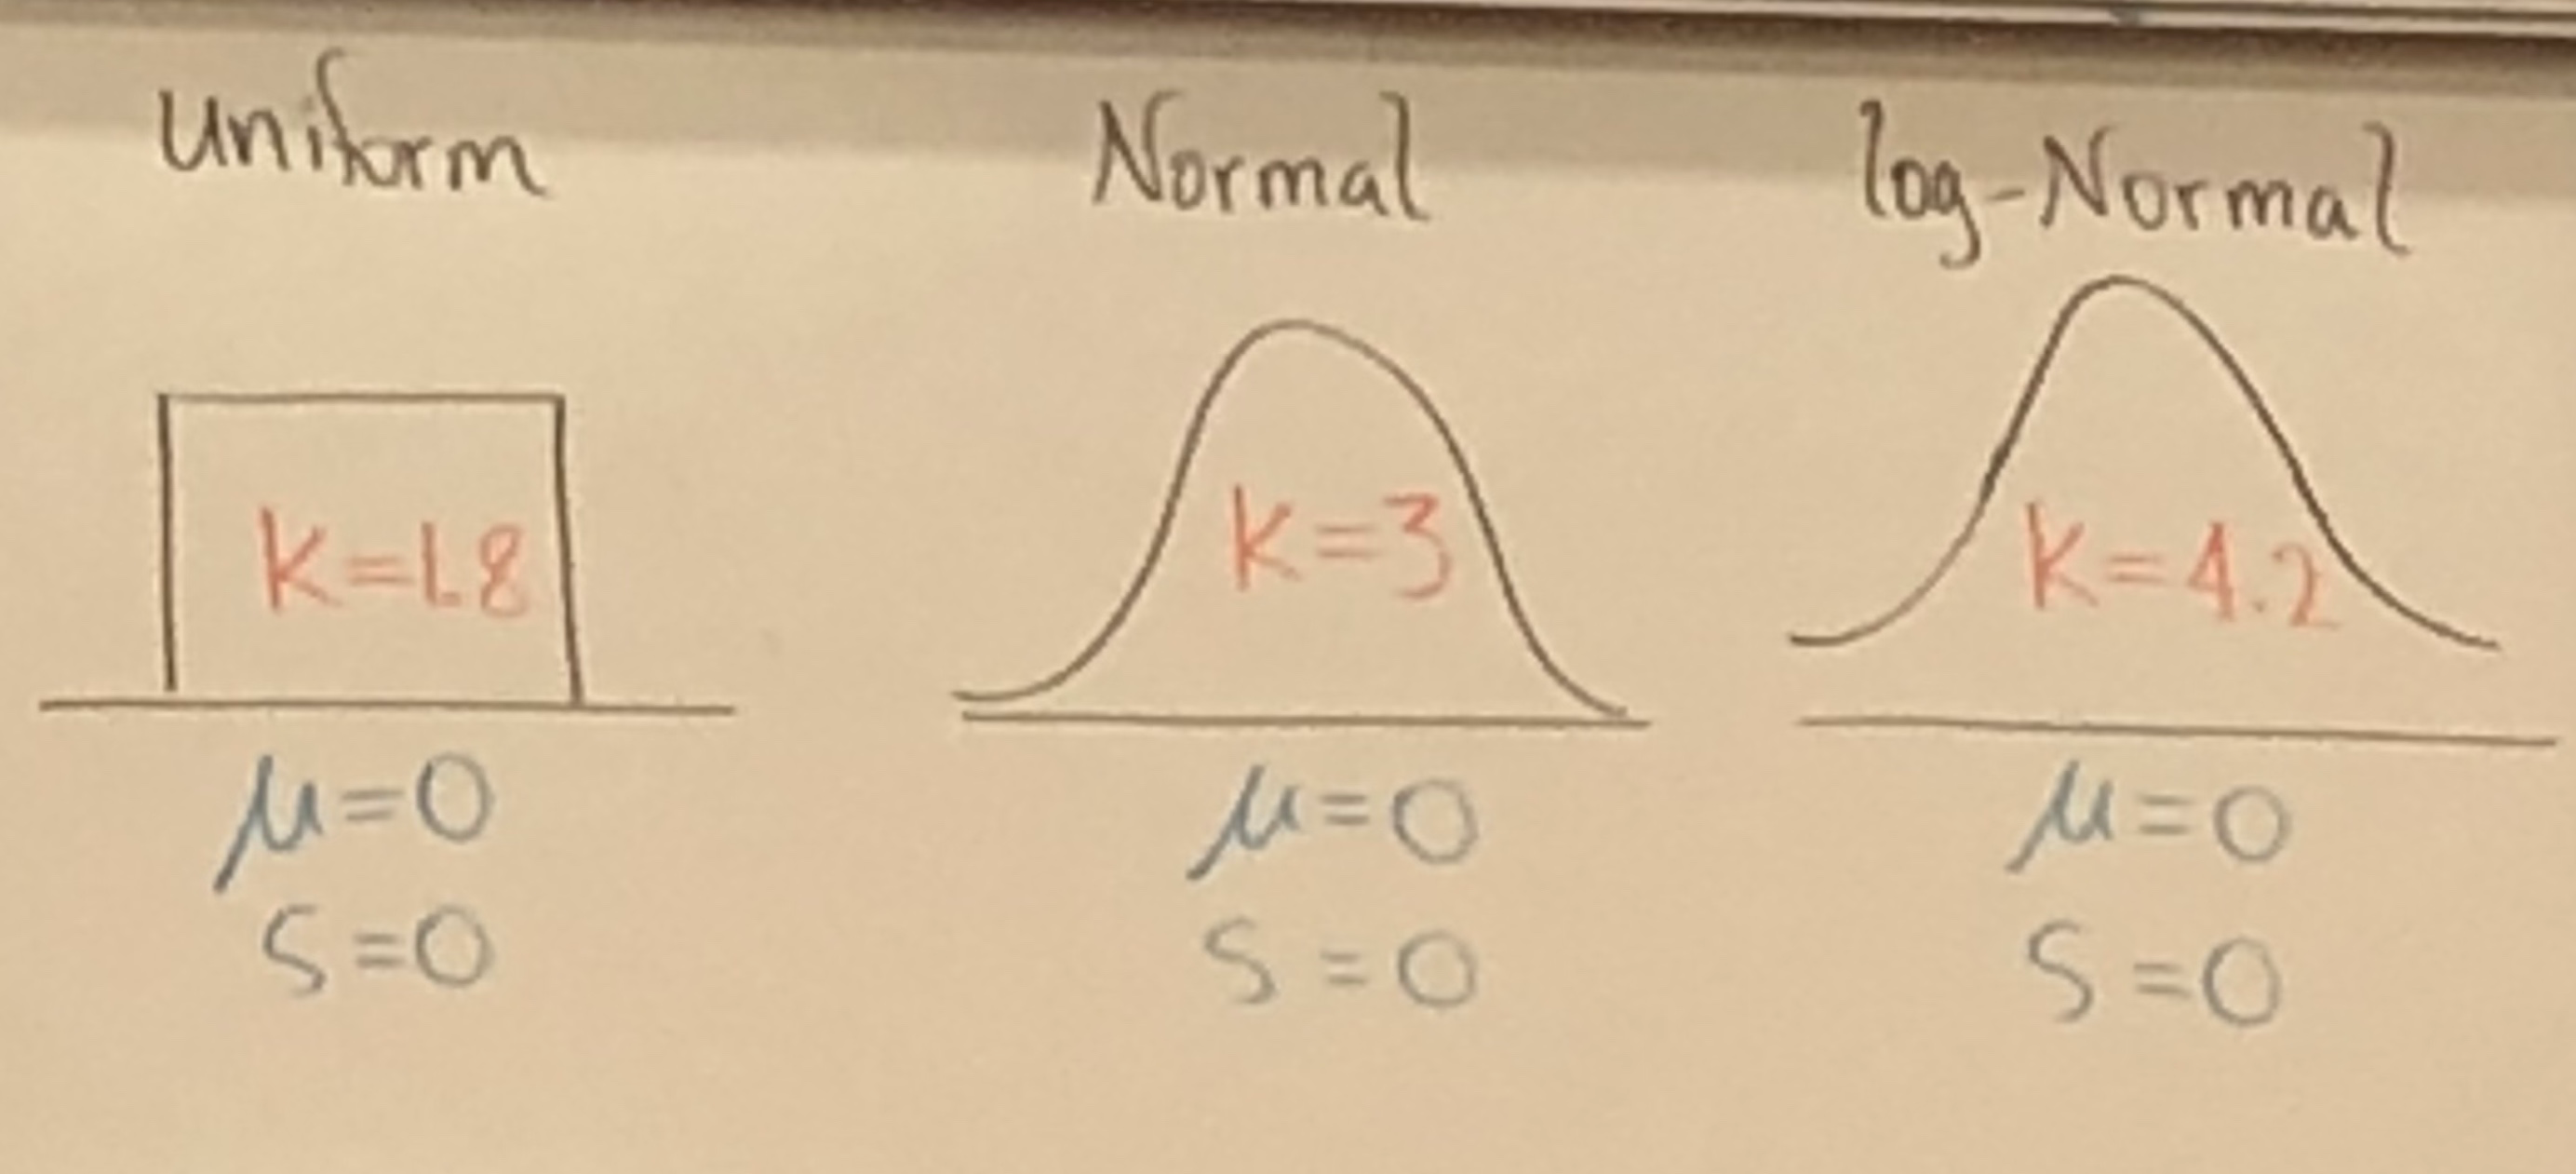
Skewness measures symmetry;

S< -1 or S>1 Highly Skewed;
-1 < S < OR < S<1 Moderately Skewed;
< S < Approx Symmetric.
