Objective: point estimate → confidence intervals → prob distribution
Need: Parameters, means, standard errors.
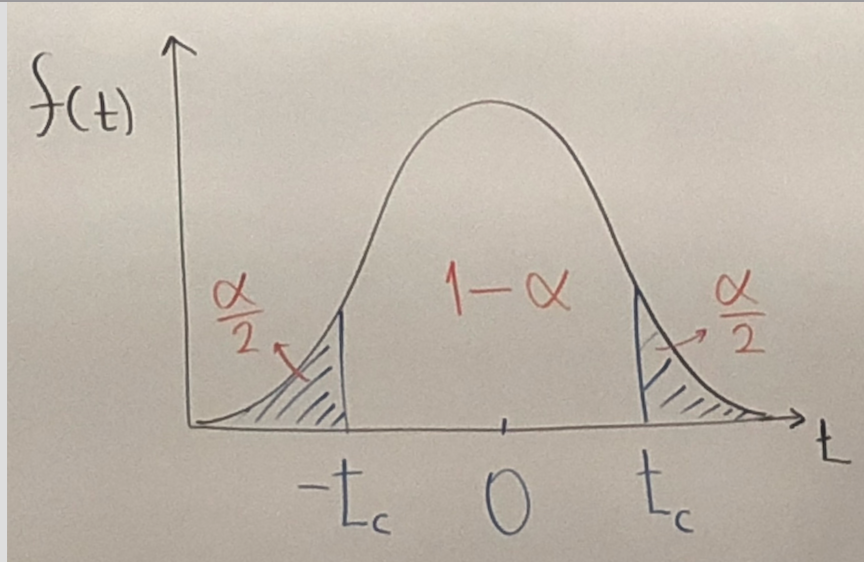
Recall that is not normally distributed, more consistent with a t-distribution.
Test statistic ~ , for →
, → →

Def: , where the interval has a probability of containing the true but unknown parameter
Example:
→
→ (95%:)
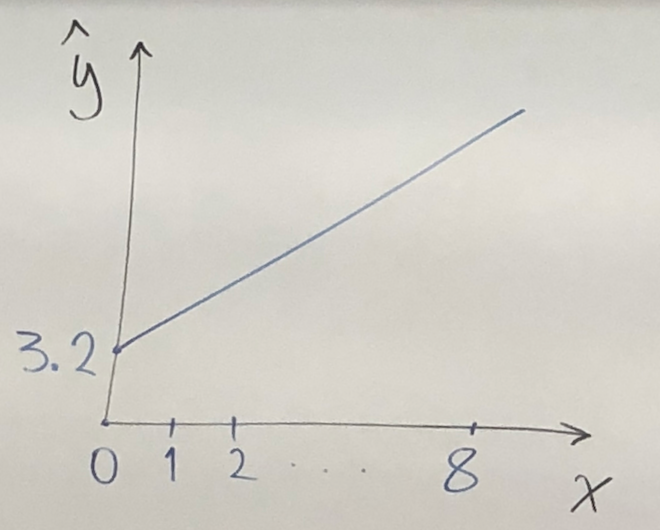
Interpretation: We estimate with 95% confidence, that from an additional $100 of weekly income, household food expenditure are expected to increase between $5.97 and $14.45
Determine and ;
Test statistic and distribution;
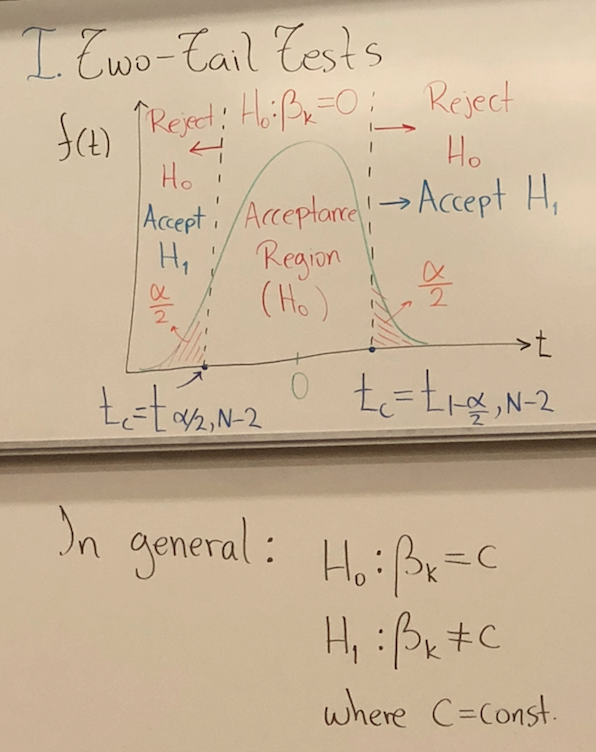
Select , and determine the regression region;
Compute the test statistic from the sample;
Compute the p-value, probability value of the test;
Conclusion:

are constants;
(two tile), (one tile);
, → ~
Notes: very useful when computing
Find and
Let
Known: artists, = quality rating = RATING[=1(poor), =7(excellent)], work experience = EXPER[years],

Interpretation: on average, a technical artist’s quality rating is expected to increase by 0.076 for every additional yer of experience
In what are you 95% confident? See p743 Table 2,
→ (not stat. significant)
Interpretation: We are 95% confident that the method we used to compute the CI, will yield an interval that contains the true parameter .
use
→
→ faill to reject is not stat sign.
use
Since , reject ,
→ Experience has a positive effect on quality rating.
the p-value$=0.0982,$ if P(type I Error = )= , do we reject or not
→ p-value → Fail toe tejrct
Let is a linear function.
→
Special case
, → (general linear Combination)
→ , →
,
→
Known:
→
→
→
→
→
→ fail to reject
Midterm on Feb 1st will include Chapter 1-3.